Elevate your expertise with our CPD UK Data Analytics Certification Program, empowering professionals in the dynamic field of Data Analytics


Embark on a transformative journey with our CPD UK Data Analytics
Certification Program, meticulously crafted to empower participants with essential
skills and knowledge for success in the dynamic realm of Data Science.
Tailored for
working professionals, this comprehensive course seamlessly integrates hands-on training with
theoretical concepts, offering a robust foundation in data analysis, machine learning, data
visualization, and beyond.
Upon successful completion, participants will be
conferred with a prestigious CPD UK certification, solidifying their expertise in Data Science and
opening doors to new horizons in the world of analytics. Join us and unlock the potential to
excel in the ever-evolving field of data analytics.

Excel functions and formulas for data analysis
Data
cleaning, filtering, and sorting in Excel
Pivot tables and data visualization using
charts
Importing and exporting data to/from Excel
SQL Introduction: A description of SQL, its significance In
data
management, and its function in searching and managing
databases.
Data
Retrieval with SELECT: The SELECT statement’s
fundamentals, searching single and more
columns, utilizing
filtering criteria, and sorting data.
Understanding the WHERE
clause and its operators to filter
data based on specific requirements.
Sorting
and Ordering Data: Using ORDER BY, sort query results
in ascending or descending order,
and sorting across
multiple columns.
Introduction to aggregate functions such as
COUNT, SUM,
AVG, MIN, and MAX for computations on data sets.
Data Grouping using
GROUP BY: Data is grouped based on
one or more columns and aggregate functions are
applied
to each group.
HAVING Filtering Grouped Data: Using the HAVING
Introduction to Power BI: Understanding the Power
BI
ecosystem, including Power BI Desktop, Power BI Service,
and Power BI
Mobile
Data Preparation and Modelling in Power BI: Cleaning and
transforming data
using Power Query Editor. Creating
relationships and data models to establish
connections
between tables
DAX functions in Power BI: DAX function, Joins,
Sets,
filtering, measures, calculated column
Data Visualization and Reporting in
Power BI: Utilizing
various visualizations (e.g., charts, graphs, maps, tables)
to
represent data effectively. Implementing filters, slicers,
and drill-through
capabilities for interactive analysis.
Sharing and Collaboration with Power BI:
Publishing and
sharing reports & Dashbard
Introduction to Tableau
Data Connection and Preparation in
Tableau: Importing and
connecting data from various sources (e.g., Excel,
databases,
web) to Tableau.
Data Visualization and Analysis in Tableau:
Creating
interactive filters, actions, and parameters to enable
userdriven
exploration.
Interactive Dashboards and Storytelling in Tableau:
Building
interactive dashboards by combining multiple visualizations
and adding
interactivity.
Sharing and Collaboration with Tableau: Publishing and
sharing
dashboards and visualizations on Tableau Server or
Tableau Public.
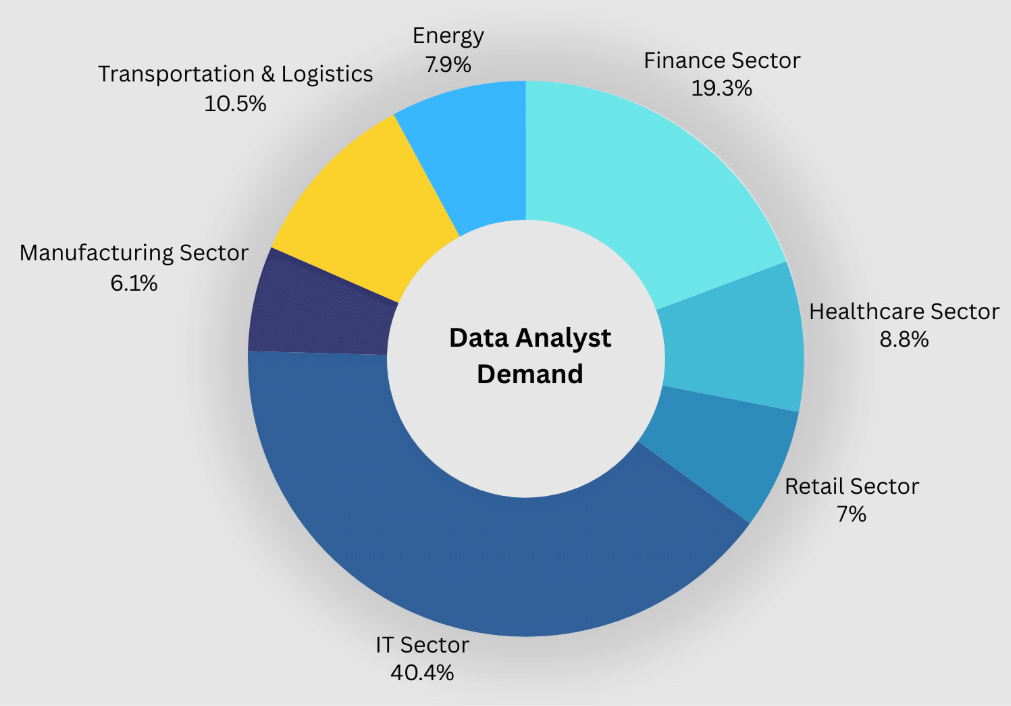
Overview of data analytics and its applications in
different
industries.
Key Concepts and Terminologies in data
analytics.
Introduction to data lifecycle and data-driven decision making.
Data collection methods and sources
Data cleaning and
preprocessing techniques
Handling missing data and outliers
Measures of central tendency and dispersion
Data
visualization techniques for exploratory analysis
Summarizing and interpreting data
distributions
Hypothesis testing and statistical inference
Correlation
and regression analysis
ANOVA and other statistical techniques for data analysis
Measures of central tendency and dispersion.
Data
visualization techniques for exploratory analysis.
Summarizing and interpreting data
distributions.
Introduction to Python programming language
Data
manipulation and analysis using libraries like Pandas
and NumPy
Data visualization
with Matplotlib and Seaborn
Handling missing data and data cleaning techniques
Hands-on projects applying Power BI and Tableau to
realworld
finance and accounting scenarios.
Case studies demonstrating the use of
visualization tools in
financial decision-making.


Enhance Your Employability and Recognition by Combining your degree and experience
with success
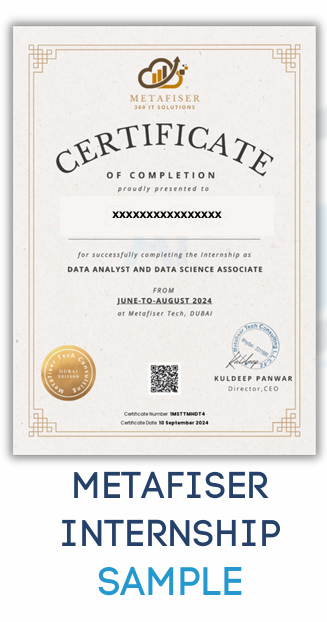
in the Data Science Institute’s Industry Recognised and Approved Professional
Certifications.


To know about the program registration and other details, please fill up your details here. So, that our program coordinator can contact you.
The batches for the program will be scheduled on weekends only.
To know about the program fees and other details, please fill up your details here. So, that our program coordinator can contact you.
It can range from 2 to 2.5 Months, depending on the Batch Speed.
The CPD UK Certification holds international recognition and is valued by employers worldwide. It signifies a high standard of professional competence